Cerebellum, Purkinje, Mossy, and All That Jazz!

Cellular Anatomy

The cerebellum is a large outgrowth on the backside of the brainstem that looks like a piece of cauliflower. It is the great "modulator" of movement. It compares the movement that the brain wants to do with what the body is actually doing. It then makes fine adjustments to ensure that the intended movement is smooth and fluid. It works in conjunction with the basal ganglia and motor cortex to modulate movement.

As can be expected, the cerebellum is highly complex with inputs and outputs going to various regions of the brain and spinal cord. Before we delve into the circuitry of the cerebellum, we need to first understand its cellular architecture…

Unlike most of the cerebral cortex, the cerebellar cortex has only three layers. They include – from most superficial to deep – the molecular layer, the Purkinje cell layer, and the granular layer.

The molecular layer is composed of connections between the dendrites (ie: information receiving processes) of Purkinje cells and the axons (ie: information sending processes) of granule cells. The molecular layer also contains stellate and basket cells, which help modulate the connections between Purkinje and granule neurons.

The Purkinje layer is, you guessed it, composed of Purkinje neurons. These cells send dendrites into the molecular layer where they receive information from granule cells. Purkinje cells also directly receive signals from other areas of the brain and spinal cord. Purkinje cells then send information along to the deep cerebellar nuclei, which are discrete collections of neurons within the cerebellum.

Finally, the granular layer is populated with granule and Golgi cells. They send axons into the molecular layer, which serve to pass on information to the dendrites of Purkinje cells in the molecular layer.

Confused yet???

Input Circuitry

In order for the cerebellum to modulate movement it must receive input from multiple sources. At this point, we have to introduce three new terms: climbing fibers, mossy fibers, and aminergic fibers.

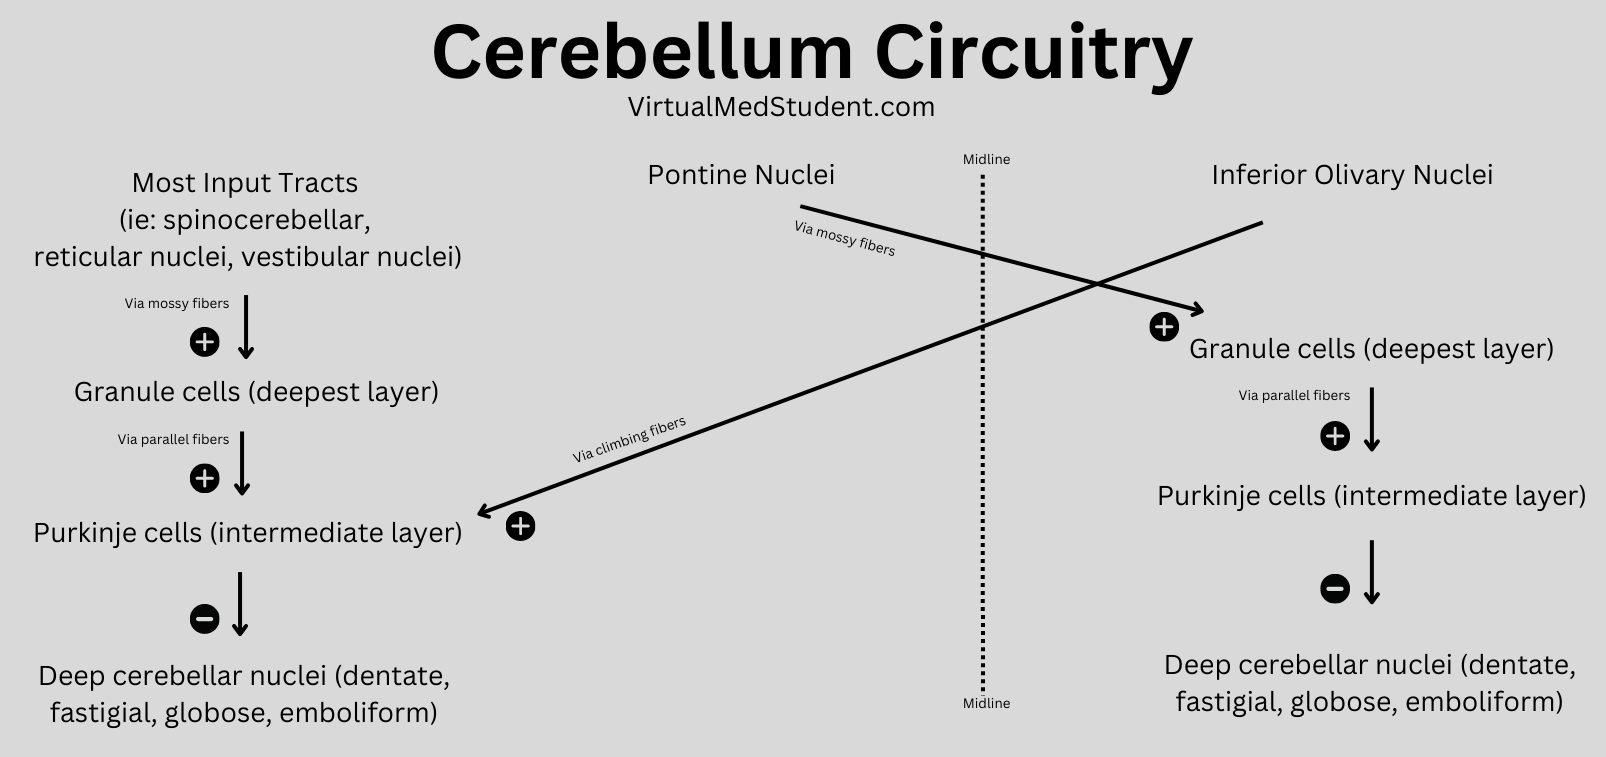
Neurons in an area of the brainstem known as the "olive" (a part of the medulla oblongata) send climbing fibers into the cerebellum. Each climbing fiber forms direct and powerful excitatory connections with multiple Purkinje cells (interestingly, each Purkinje cell only receives input from one climbing fiber).

The second input, mossy fibers, originate from several different areas outside the cerebellum (see table below). These axons form connections with the granule cells. The granule cells, if you remember from our discussion above, send axons into the molecular layer where they form connections to Purkinje cell dendrites. Therefore, mossy fibers indirectly influence Purkinje cells through the "intermediary" granule cells.

Input Connections (ie: Afferent Fibers) to the Cerebellum

Source of Input Type of Fiber Target of Input
Olivary nuclei (brainstem) Climbing fibers Contralateral cerebellum
Pontine nuclei (brainstem) Mossy fibers Contralateral cerebellum
Reticular nuclei (brainstem) Mossy fibers Ipsilateral cerebellum
Ventral spinocerebellar tract Mossy fibers Ipsilateral cerebellum
Dorsal spinocerebellar tract Mossy fibers Ipsilateral cerebellum
Vestibular nuclei Mossy fibers Ipsilateral cerebellum
Locus ceruleus Norepinephrine Bilateral projections
Raphe nucleus Serotonin Bilateral projections

Aminergic fibers originate from the locus ceruleus in the pons, and the raphe nuclei of the midbrain, pons, and medulla. The locus ceruleus fibers "spit" norepinephrine and the raphe nuclei "spit" serotonin onto multiple areas within the cerebellum.

All of these inputs (as well as basket, stellate and Golgi cells, which are intrinsic to the cerebellum itself) are trying to influence the output of the Purkinje neurons. The Purkinje cells ultimately synthesize and pass along all of this competing information via an inhibitory message to the deep cerebellar nuclei.
And that folks brings us to our next section: the output circuitry…

Output from the cerebellum passes exclusively from the deep cerebellar nuclei. The deep nuclei are four discrete collections of neurons, which are given specific (and funky) names; they include the fastigial, globose, emboliform, and dentate nuclei.

Remember that the Purkinje cells inhibit the output of the deep cerebellar nuclei. Therefore, the more active the incoming messages (via mossy and climbing fibers) –> the more active the Purkinje cells –> the less active the output of the deep cerebellar nuclei.

The output of the deep nuclei goes to four major structures outside the cerebellum: the red nucleus, the vestibular nucleus, the reticular formation, and the thalamus. From these structures the information is passed along to the cerebral cortex and/or the spinal cord for additional processing.

Output Connections (ie: Efferent Fibers) from the Cerebellar Nuclei

Source of Output Target of Output Function
Globose nucleus Contralateral red nucleus
Contralateral thalamus
Influences tone of flexor
muscles
Emboliform nucleus Contralateral red nucleus
Contralateral thalamus
Influences tone of flexor
muscles
Dentate nucleus Contralateral thalamus Influences motor cortex
and coordination
Fastigial nucleus Bilateral vestibular nucleus
Bilateral reticular formation
Influences motor neurons in
spinal cord and helps
control tone of extensor
muscles

Ultimately, the output of the cerebellum influences not only coordination, but also the tone of flexor and extensor muscles. This allows movement to be smooth and coordinated (unless of course, you are me on the dance floor… in that case all bets are off!).

Overview

The cerebellum is an extremely complex part of the brain. It receives information about an intended movement from the cerebral cortex and compares that to sensory information coming back from the spinal cord. If the intended movement doesn’t match the actual movement the output of the cerebellum attempts to restore balance.

References and Resources

  • Ikai Y, Takada M, Shinonaga N, et al. Dopaminergic and non-dopaminergic neurons in the ventral tegmental area of the rat project, respectively, to the cerebellar cortex and deep cerebellar nuclei. Neuroscience, V51:3, p 719-28.
  • Asanuma C, Thach WT, Jones EG. Brainstem and spinal projections of the deep cerebellar nuclei in the monkey, with observations on the brainstem projections of the dorsal column nuclei. Brain Research Reviews. V5:3, May 1983. pp 299-322.
  • Huang CC, Sugino K, Shima Y, et al. Convergence of pontine and proprioceptive streams onto multimodal cerebellar granule cells. Elife. 2013;2:e00400. Epub 2013 Feb 26.
  • Baehr M, Frotscher M. Duus’ Topical Diagnosis in Neurology: Anatomy, Physiology, Signs, Symptoms. Fourth Edition. Stuttgart: Thieme, 2005.
  • Purves D, Augustine GJ, Fitzpatrick D, et al. Neuroscience. Fourth Edition. Sinauer Associates, Inc., 2007.
Hans Krebs and His Cycle: Oxidation and Energy

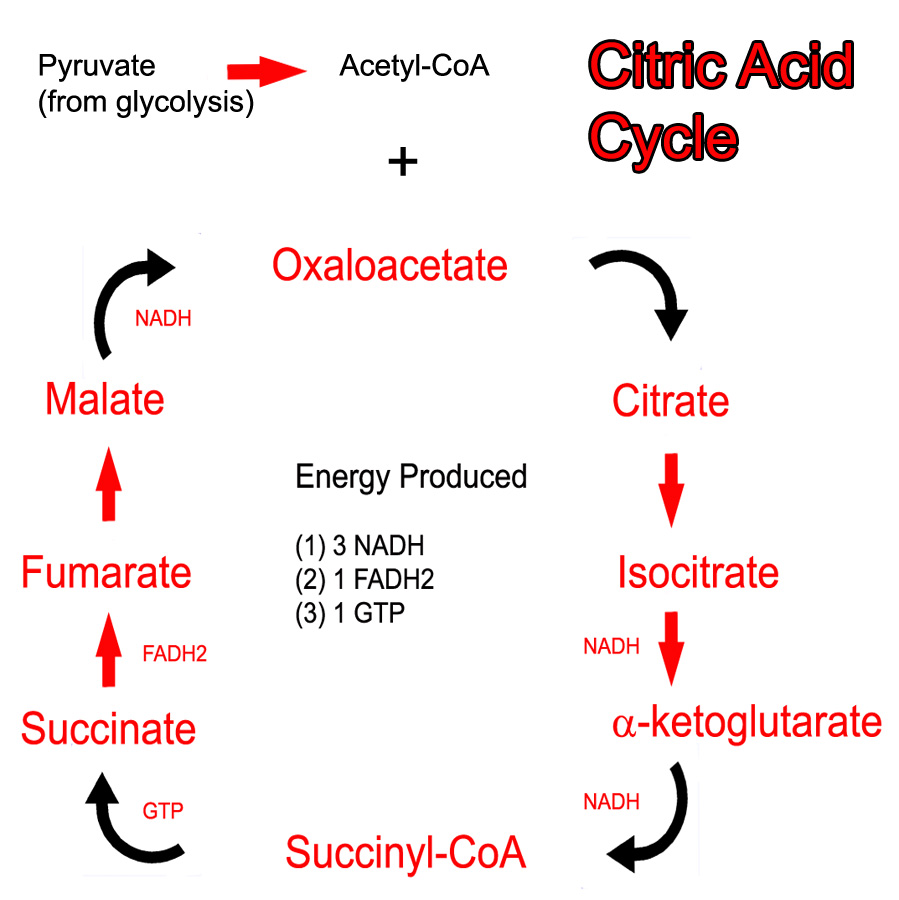
The main role of the citric acid cycle is to continue the oxidation (ie: energy "stripping") of acetyl-CoA. Acetyl-CoA can be obtained from the oxidation of pyruvate (the final molecule of glycolysis) or from the oxidation of long chain fatty acids.

The cycle begins when acetyl-CoA combines with oxaloacetate to form citrate. Several chemical reactions occur and citrate gets converted back to oxaloacetate (see cycle below). At this point, oxaloacetate re-combines with another acetyl-CoA to restart the cycle. Note that pyruvate and acetyl-CoA are NOT technically considered part of the cycle.

The Kreb’s cycle (aka: citric acid cycle) produces both energy and "waste". The waste are two molecules of carbon dioxide, which are formed from the two carbons present in the original acetyl-CoA molecule. The energy comes from removing electron pairs from the molecules in the cycle.

Citric Acid Cycle
These electrons are stored in the energy rich molecules NADH and FADH2. NADH and FADH2 donate the electrons to carrier molecules in the electron transport chain. The final result is the production of adenosine triphosphate (ATP), an energy rich molecule that can be used by cells for various purposes. In addition, the citric acid cycle also produces an ATP equivalent molecule known as guanosine triphosphate (GTP).

The cycle itself operates in the mitochondrial matrix. This is no mistake because the enzymes of the electron transport chain are located on the adjacent inner mitochondrial membrane; the NADH and FADH2 produced by the cycle do not have to travel far in order to donate their electron pairs.

Regulation

Two key enzymes control the citric acid cycle. The first is isocitrate dehydrogenase. This enzyme converts isocitrate to α-ketoglutarate. It is inhibited by ATP and NADH, and stimulated by ADP. If we think about it, this makes sense because if ATP and NADH are abundant (ie: the cell has adequate energy stores), then we want the cycle to slow down. ADP is the breakdown product of ATP and represents an energy depleted state. Thus, ADP stimulates the cycle so that more energy can be produced.

The second regulatory enzyme is α-ketoglutarate dehydrogenase. This enzyme converts α-ketoglutarate to succinyl-CoA. It is inhibited by succinyl-CoA (an example of feedback inhibition), NADH, and ATP. The rationale behind this inhibition is similar to isocitrate dehydrogenase.

These two steps are also regulatory because they are highly exergonic. This means that they release lots of energy, so much so, that they are effectively irreversible reactions.

Overview

The main goal of the citric acid cycle is to produce energy by oxidizing acetyl-CoA. The energy produced comes in the form of NADH and FADH2. These molecules donate their electrons (energy) to the electron transport chain, which ultimately drives oxidative phosphorylation. This allows the formation of energy rich ATP, which can be used by the cell for numerous processes.

References and Resources

  • Nelson DL, Cox MM. Lehninger Principles of Biochemistry. Fifth Edition. New York: Worth Publishers, 2008.
  • Champe PC. Lippincott’s Illustrated Reviews: Biochemistry. Second Edition. Lippencott-Ravens Publishers, 1992.
  • Le T, Bhushan V, Grimm L. First Aid for the USMLE Step 1. New York: McGraw Hill, 2009.

A Simple Approach to Hemodynamic Instability

What is “hemodynamic instability”? Hemodynamics is the study of blood movement; when this movement is compromised in some way you get hemodynamic instability. If left untreated it can cause multi-organ failure and death.

You can think of hemodynamic instability as the collapse of the cardiovascular system. This collapse causes a significant drop in blood pressure.

There are many causes of hemodynamic instability and fortunately you don’t need to know all of them to manage a patient who is acutely experiencing cardiovascular collapse. A few basic tenets of physiology, when examined in the right order, will help you manage a patient who is unstable.

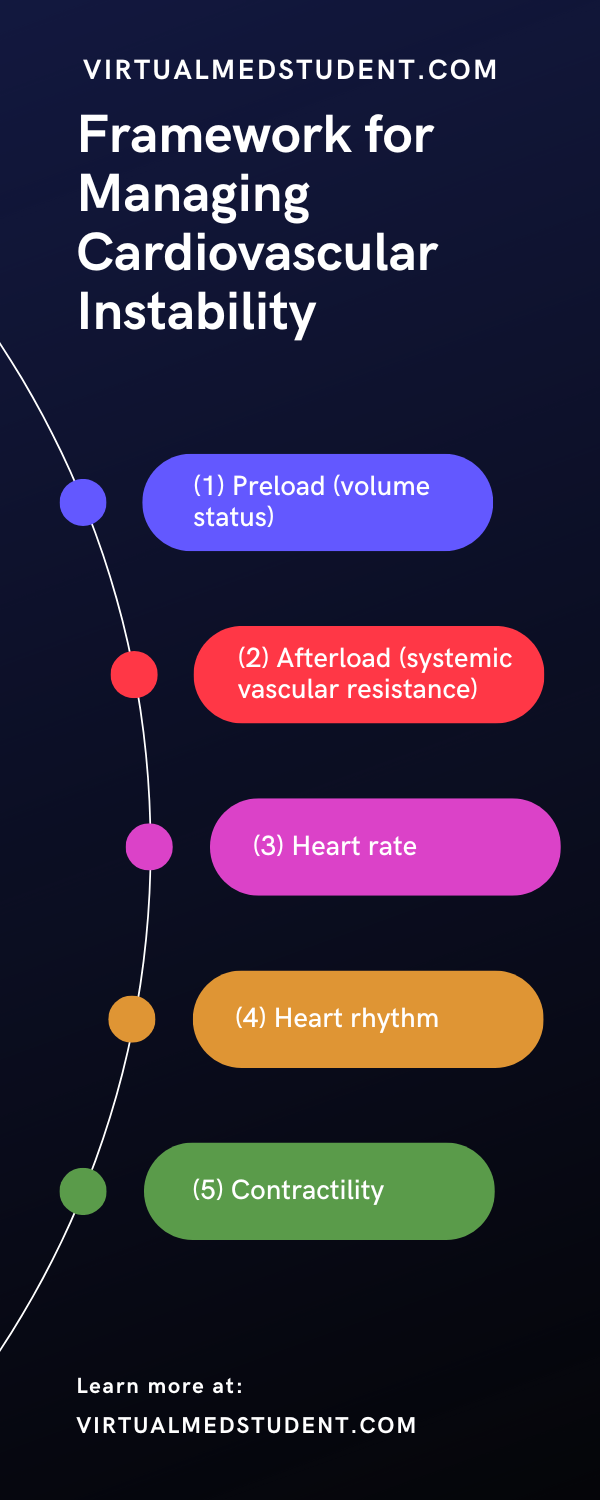
The tenets are as follows: preload (volume status), afterload (systemic vascular resistance), heart rate, heart rhythm, and contractility.

Preload and Volume Status

The first component of cardiovascular physiology that should be assessed in a hemodynamically unstable patient is preload and intravascular volume. Intravascular volume measures how much blood is present in the circulatory system. If a patient is volume deplete (ie: has a decreased intravascular volume) then hemodynamic instability can occur. An easy way to visualize this is to imagine someone bleeding. If the bleeding is not stopped, the cardiovascular system will eventually collapse. In the hospital this is often referred to as a patient being "dry".

Preload is one way to estimate a patient’s intravascular volume. Measuring preload is easy if you have a central venous catheter, and even easier if you have a Swan Ganz catheter, although these are used less frequently nowadays. These types of catheters can measure central venous and pulmonary artery pressures, which provide a good estimate of intravascular volume status.

If a patient does not have a central line you have to rely on clinical clues. One way to assess intravascular volume is to measure urine production. If urine output is less than normal, then the patient is trying to “hold on” to fluid, and therefore may be volume deplete. Urine that is dark amber in color is another clue. Decreased skin turgor is another clinically useful sign. Examining a patient’s neck veins (ie: jugular venous pulsations) can also be useful under certain circumstances.

In essence, if a patient’s preload, and therefore intravascular volume status is decreased it can be quickly corrected by giving the patient intravenous fluids. The type of fluid given is dictated by the clinical situation, but the most commonly used fluids for hemodynamic resuscitation are normal saline, lactated Ringer’s solution, and good old fashioned blood (especially when blood loss is responsible for the decreased volume!).

That’s great! But what do we do if we assess the patient’s volume status and come to the conclusion that it is sufficient, and the patient is STILL hemodynamically unstable? Not to fear… Let’s move on to the next tenet – systemic vascular resistance.

Systemic Vascular Resistance (SVR) and Afterload

The systemic vascular resistance is the resistance that blood sees as it travels through the arterial system. The vascular resistance varies depending on the etiology and time frame of the hemodynamic instability.

For example, patients in the initial stages of hypovolemic shock (ie: acute blood loss) the SVR will be elevated as the arteries constrict to maintain blood pressure; however, once the blood volume reaches critically low levels even constriction of the arteries is not enough to maintain the SVR. At this point the blood pressure will drop precipitously.

In contrast, patients in septic shock have a decreased systemic vascular resistance as the blood vessels dilate pathologically in response to infection. The result is the same as the above example: the blood pressure drops.

So how do we treat a decrease in systemic vascular resistance? Assuming intravascular volume (ie: preload) is adequate we sometimes need to "help" the patient constrict their blood vessels so they can maintain an adequate blood pressure. We do this using medications known as "pressors". The most commonly used pressors are norepinephrine (Levophed®), phenylephrine (Neosynephrine®), vasopressin, and dopamine.

Pressors should only be used once a patient has been treated with volume resuscitation. In other words, it does not make sense to help someone constrict their blood vessels when they have no intravascular volume to constrict around! This is why SVR is the 2nd (and not the 1st) tenet of managing someone with hemodynamic instability.

Heart Rate

Once intravascular volume status and vascular resistance have been dealt with, the next step is to monitor the heart rate. Patients who are excessively tachycardic (ie: high heart rate) or bradycardic (ie: low heart rate) can also be hemodynamically unstable. Let’s explain…

During tachycardia the left ventricle does not have as much time to fill with blood. Therefore, each beat of the heart ejects less blood than normal. If the tachycardia is severe enough this can cause hemodynamic instability and decreased blood flow. Likewise, in patients who are excessively bradycardic the amount of blood ejected over a specific unit of time (aka: cardiac output) may not be enough to sustain the bodies need for blood.

Patients who are excessively tachycardic can be treated with beta blockers assuming there is no other cause readily identified. It is also important to remember that tachycardia may be a sign of decreased intravascular volume! Therefore, the patient’s excessive heart rate may correct when the preload is corrected (again, always start at tenet number 1!).

Bradycardia can be treated with atropine. Atropine is a molecule that stimulates heart rate by blocking the actions of acetylcholine. It is also important to note that bradycardia is sometimes a "physiologic" response to the administration of pressors. For example, phenylephrine often causes a "reflex" bradycardia.

Heart Rhythm

Just like abnormal heart rates, abnormal heart rhythms can also cause hemodynamic instability. The most commonly encountered abnormal rhythms in hemodynamically unstable patients are atrial fibrillation, atrial flutter, heart block, ventricular fibrillation, and ventricular tachycardia.

Abnormal heart rhythms contribute to hemodynamic instability by decreasing the filling capacity of the heart. For example a patient in rapid atrial fibrillation will not have enough time between heart beats to load their left ventricle with blood.

The treatment of the various cardiac arrhythmias depends on the type of rhythm. It is important to note that abnormal rhythms may not have a significant impact on hemodynamic instability, and may need no additional treatment. This is most commonly encountered in people who are in atrial fibrillation, but their rate is well controlled.

Contractility

You’ve fixed intravascular volume, corrected the systemic vascular resistance, examined the heart rate and rhythm and you still can not stabilize the patient. Under these circumstances you have to think about the heart itself. It may not be ejecting blood efficiently or effectively enough to ensure cardiovascular stability.

Under these circumstances you need to order an echocardiogram to assess the heart’s function. If the heart is not holding its own it may need a little help. Medications such as epinephrine, dopamine, dobutamine, milrinone, and digoxin can help give the heart a little extra “squeezing power” to improve cardiac output.

Overview

The management of hemodynamic instability always begins with an assessment of intravascular volume (preload). If repleting intravascular volume does not fix the problem then the next step is to look at systemic vascular resistance. Does the patient need a little help constricting those blood vessels? If not, than you have to move quickly to assessing heart rate and rhythm. Finally, when all else fails, we have to assess the contractility of the heart. Maybe it isn’t pumping as hard or as efficient as it should be.

Correcting hemodynamic instability in the above order is both a quick and efficient framework for thinking about the unstable patient. Often times the physician will drop quickly down the list as they recognize a problem immediately (ie: rapid atrial fibrillation) and this is ok!!! The important thing is to have a framework for thinking about cardiovascular instability.

References and Resources

  • Stiell IG, Macle L. Canadian Cardiovascular Society atrial fibrillation guidelines 2010: management of recent-onset atrial fibrillation and flutter in the emergency department. CCS Atrial Fibrillation Guidelines Committee. Can J Cardiol. 2011 Jan-Feb;27(1):38-46.
  • Bozza FA, Carnevale R, Japiassú AM, et al. Early fluid resuscitation in sepsis: evidence and perspectives. Shock. 2010 Sep;34 Suppl 1:40-3. Review.
  • Price S, Uddin S, Quinn T. Echocardiography in cardiac arrest. Curr Opin Crit Care. 2010 Jun;16(3):211-5.
  • Naeem N, Montenegro H. Beyond the intensive care unit: a review of interventions aimed at anticipating and preventing in-hospital cardiopulmonary arrest. Resuscitation. 2005 Oct;67(1):13-23.
  • Sevransky J. Clinical assessment of hemodynamically unstable patients. Curr Opin Crit Care. 2009 Jun;15(3):234-8.

Phenylketonuria: A Musty Aminoacidopathy

Phenylketonuria is one of the “aminoacidopathies”. An aminoacidopathy is a fancy medical term for a malfunction in the bodies’ ability to handle specific amino acids, in this case, phenylalanine.

But before we get too crazy, first things first… What is an amino acid? Amino acids are the building blocks of proteins. Each amino acid consists of a carbon atom that has four “things” hanging off of it: an amine group, a carboxylic acid group, a hydrogen atom, and finally an “R” group. The “R” group varies depending on the specific amino acid being discussed. For example, the “R” in phenylalanine is a benzyl group.

Amino acids link up together via “peptide bonds”. A peptide bond is simply the carboxylic acid group of one amino acid “hooking” up to the amine group of another amino acid. This linking occurs over and over again resulting in a protein that can be thousands of amino acids in length.

With that background, let’s discuss one specific amino acid, phenylalanine, and what happens when the body has difficulty using it – a condition called phenylketonuria.

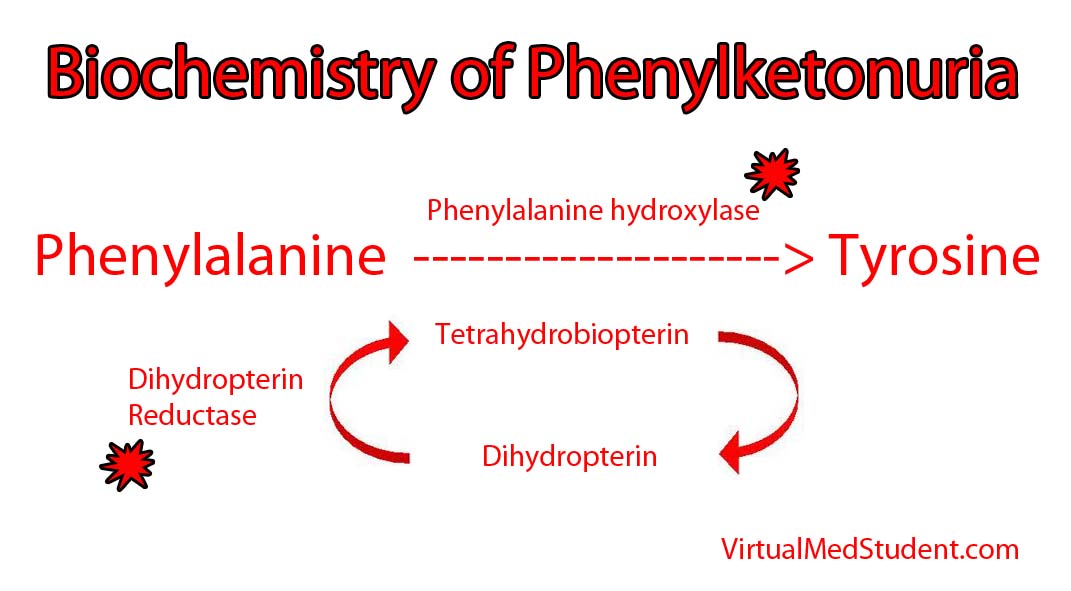
An enzyme in the liver called phenylalanine hydroxylase is necessary to transform phenylalanine into another amino acid called tyrosine. In certain individuals, the genes on chromosome 12 that encode the hydroxylase enzyme are deficient. Mutations in both of your hydroxylase genes (ie: the one you got from mom and the one you got from dad) must be deficient for phenylketonuria to develop; in other words, one adequate gene can produce enough normal hydroxylase to handle a normal dietary phenylalanine load. However, when both genes are deficient, phenylalanine can accumulate to abnormally high levels in the blood.

It is important to note that phenylketonuria can occur even if the hydroxylase enzyme is normal! How is this possible? The answer is because the hydroxylase enzyme requires another molecule called tetrahydrobiopterin (try saying that 3 times fast!) to function properly. When the enzyme (dihydrobiopterin reductase) that produces tetrahydrobiopterin is deficient, it gunks up the entire system and slows the ability of phenylalanine hydroxylase to convert phenylalanine to tyrosine.

Phenylketonuria

Either way you slice it, the excess phenylalanine interferes with the ability of other amino acids to enter the brain. This hinders brain development and, if left untreated, can cause mental retardation.

Signs and Symptoms

When excess phenylalanine backs up in the blood stream it blocks amino acid transporters in the brain. As a result, the brain does not get access to other essential amino acids, and patients that are left untreated, develop mental retardation and seizures.

Children affected by the condition also commonly have a musty odor. The odor is caused by phenylacetate, which is a breakdown product of excess phenylalanine.

Interestingly, patient’s who suffer from phenylketonuria are also usually blond haired and blue eyed. The reason for this is that tyrosine is necessary for melanin formation. Melanin is the pigment that gives hair, skin, and eyes their color. In phenylketonuria, phenylalanine is not converted to tyrosine and therefore melanin is not produced. The resultant lack of pigment causes blond hair and blue eyes.

Diagnosis

Many countries screen new babies for phenylketonuria because mental retardation can be prevented with strict dietary control. Diagnosis is based on finding an elevated phenylalanine to tyrosine ratio in the blood. Additionally, phenylpyruvate (a breakdown product of phenylalanine) will be elevated in urine samples of affected individuals.

Treatment

Treatment is, you guessed it, avoiding phenylalanine! This is done by ingesting a low protein diet, and in babies, using formula that is free of phenylalanine.

In phenylketonuria, tyrosine becomes an essential amino acid. Therefore, an important aspect of treatment is ensuring adequate intake of tyrosine via supplementation.

Overview

Phenylketonuria results when the body is unable to convert the amino acid phenylalanine into tyrosine. It can be caused by a primary genetic deficiency in the enzyme phenylalanine hydroxylase. It can also be caused by defects in the production of the hydroxylases’ necessary cofactor, tetrahydrobiopterin. Symptoms, if left untreated, include mental retardation. Patients with phenylketonuria are generally fair skinned and blue eyed because they have difficulty producing the melanin. Treatment is avoidance of phenylalanine and supplementation with tyrosine.

Related Articles

References and Resources

  • Cunningham GC. Phenylketonuria – early detection, diagnosis and treatment. Calif Med. 1966 July; 105(1): 1–7.
  • van Spronsen FJ, Huijbregts SC, Bosch AM, et al. Cognitive, neurophysiological, neurological and psychosocial outcomes in early-treated PKU-patients: A start toward standardized outcome measurement across development. Mol Genet Metab. 2011;104 Suppl:S45-51. Epub 2011 Oct 6.
  • Mitchell JJ, Trakadis YJ, Scriver CR. Phenylalanine hydroxylase deficiency. Genet Med. 2011 Aug;13(8):697-707.
  • Werner ER, Blau N, Thöny B. Tetrahydrobiopterin: biochemistry and pathophysiology. Biochem J. 2011 Sep 15;438(3):397-414. Review.

Vein of Galen Malformations: A Misnomer of Sorts

The vein of Galen is located deep within the brain. The internal cerebral veins, basal veins of Rosenthal, atrial veins, and precentral cerebellar veins join together to form the vein of Galen.

As expected, the vein of Galen drains blood from deeply located brain structures. The vein of Galen then connects with the inferior sagittal sinus to form the straight sinus; blood then drains from the straight sinus into the transverse and sigmoid sinuses, where it eventually finds its way into the internal jugular veins and back to the heart.

Interestingly, a "vein of Galen" malformation is not actually a malformation of the true vein of Galen; the term is a misnomer. It is actually a malformation of primitive fetal anatomical structures that normally regress during development. These primitive structures include a dilated venous structure, as well as "feeding" arteries. Therefore, vein of Galen malformations represent true arteriovenous fistulas; in other words, blood moves directly from an artery to a vein without an intermediary capillary bed.

Between the 3rd and 11th weeks of fetal development a large primitive vein known as the median prosencephalic vein of Markowitz drains the deepest parts of the brain. As the brain develops, the internal cerebral veins annex the territory normally drained by the anterior portion of this vein. As a result, this portion of the median prosencephalic vein regresses. The internal cerebral veins then plug in to the posterior portion of the median prosencephalic vein, which becomes the "true", or "normal", vein of Galen.

The most common arterial "feeders" of the malformation can also be explained by aberrant embryology. During early fetal brain development the distal branches of the anterior cerebral arteries (ie: the pericallosal branches) make connections with the posterior cerebral arteries. These connections usually regress to form the anterior and posterior circulations, which are connected to one another via the posterior communicating arteries.

So how does a vein of Galen malformation form? In some infants the median prosencephalic vein of Markowitz does not regress like it should. As a result, a large abnormal venous midline pouch remains. It also retains its primitive arterial blood supply from the distal branches of the anterior cerebral artery (ie: pericallosal branches), anterior choroidal arteries, posterior communicating arteries, and branches of the posterior cerebral arteries (ie: posterior choroidal arteries).

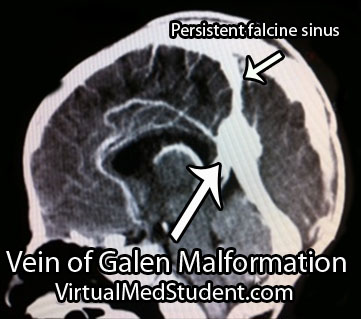
Vein of Galen malformations are also associated with other abnormalities in the venous structure of the brain. Not uncommonly, the straight sinus is absent or severely narrowed. As a result venous blood drains into a persistent falcine sinus, which is a structure that normally regresses in-utero.

To summarize, vein of Galen malformations are primitive direct arteriovenous fistulas. They are composed of a dilated venous pouch (ie: the median prosencephalic vein of Markowitz) with any combination of anterior and posterior circulation feeding arteries.

Signs and Symptoms

Signs and symptoms depend on the severity of the malformation. Severe malformations present in new borns with high output cardiac failure. This is because so much blood is being shunted into the malformation that the heart cannot keep pace!

Less significant malformations present later in infancy with a rapidly enlarging head circumference secondary to hydrocephalus, developmental delay, and seizures. The increase in venous blood pressure within the head can cause a "melting brain" syndrome in which the white matter of the brain fails to develop properly. This can lead to severe mental retardation later in life if left untreated.

Diagnosis

Vein of Galen Malformations
Diagnosis is made with a combination of MRI, CT, and diagnostic angiograms. MR venograms can show the dilated venous pouch, as well as associated venous anomalies.

CT angiograms can show associated arterial feeding vessels. Formal diagnostic angiograms are the gold standard test; they delineate both the spatial and temporal relationship of the arterial feeding vessels to the venous pouch.

Formal catheter angiograms are also necessary to distinguish true vein of Galen malformations from arteriovenous malformations of the adjacent brain tissue.

Treatment

Treatment is dependent on the age of the child as well as the severity of the malformation. The most commonly used grading system developed by Dr. Lasjaunias is known as the Bicetre score. It takes into account the child’s cardiac, pulmonary, hepatic (liver), and renal (kidney) function. Lower scores indicate more severe disease with poorer outcomes.

The Bicetre score also dictates the optimal time for treatment. If the score is very low then aggressive treatment, even in the neo-natal period, may be indicated to try and prevent death and severe disability. Higher scores are typically treated later in life; however, worse outcomes, in terms of mental retardation, have been illustrated if treatment is delayed.

Most of these lesions are treated endovascularly (ie: from inside the blood vessels). The arterial feeders are embolized with a glue like material, which ultimately shuts down the fistula in an attempt to restore normal venous pressures. The vein itself may also be filled with tiny metal coils to help reduce flow through the fistula; this is known as trans-venous endovascular therapy.

Surgical ligation of the arterial feeders has mostly become a treatment of the past. Radiation therapy with Gamma Knife has also been used in some cases; it is showing some promise as an alternative treatment modality in select cases.

Overview

Vein of Galen malformations are fetal abnormalities in the brain’s normal venous drainage. They represent true arteriovenous fistulas. They are composed of a dilated median prosencephalic vein of Markowitz and numerous arterial feeding vessels. Feeders may come from the anterior cerebral arteries, posterior cerebral arteries, or posterior communicating arteries. Symptoms are usually from high output heart failure in the neonatal period; older infants and children suffer from increasing head circumference, seizures, and developmental delay. Treatment is usually with endovascular techniques.

References and Resources

Giardia Lamblia (You Better Have a Toilet Nearby)

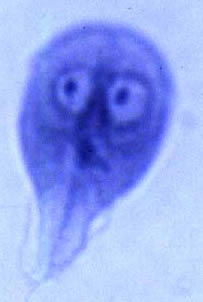
This little bastard to the left is called giardia lamblia and it is a single celled protozoan. It exits in two forms: trophozoite and cyst. The cyst form is highly resistant to destruction and can survive for weeks outside a host.

The life cycle of giardia is relatively simple. First, cysts are pooped out by a host (ie: animal or human) where they contaminate food and water supplies. They are then unknowingly ingested by a host. Once in the gut of the host, the cyst transforms into the trophozoite form. Trophozoites undergo asexual reproduction in the gut; as they reach the colon they re-encyst themselves. From there they are pooped out again to reinfect another unfortunate soul.

The trophozoite form has two nuclei (the two "eyes" in the photo to the right) and four pairs of flagella that allow it to move. The organism attaches itself to intestinal cells. How it causes symptoms is not entirely known. One possibility is that it causes inflammation of the intestinal cells resulting in a decreased ability to absorb nutrients from food.

Signs and Symptoms

Interestingly, most people infected by giardia lamblia are asymptomatic. However, in some individuals a foul smelling diarrhea results. The foul smell is due to steatorrhea (ie: undigested fat molecules). Many symptomatic people will also have belly pain, fatigue, flatulence, nausea, and possibly vomiting. All of these symptoms can give rise to weight loss.

Symptoms generally begin seven days after exposure. They generally last anywhere from two to four weeks with or without treatment. However, in a subset of patients who are untreated, symptoms may continue for months to years!

Diagnosis

Diagnosis is made most commonly by looking at the stool for proteins made by the organism (ie: giardia antigens). Also by looking at a stool sample under a microscope it is possible to directly see the trophozoites and cysts.

Treatment

Treatment is with an antibiotic known as metronidazole. This antibiotic is taken up by anaerobic bacteria and some protozoans where it is converted into toxic by products. These toxic metabolites damage DNA making the organism unable to divide; eventually, the damage causes cell death.

Overview

Giardia lamblia is a protozoan parasite that exists in two forms: trophozoite and cyst. The cyst is defecated and then ingested by another host. It turns into the trophozoite form and adheres to intestinal cells causing a foul smelling diarrhea in some individuals. Many people remain asymptomatic. Treatment is with an antibiotic known as metronidazole.

References and Resources

Polycystic Ovarian Syndrome: Hormones Gone Amuck

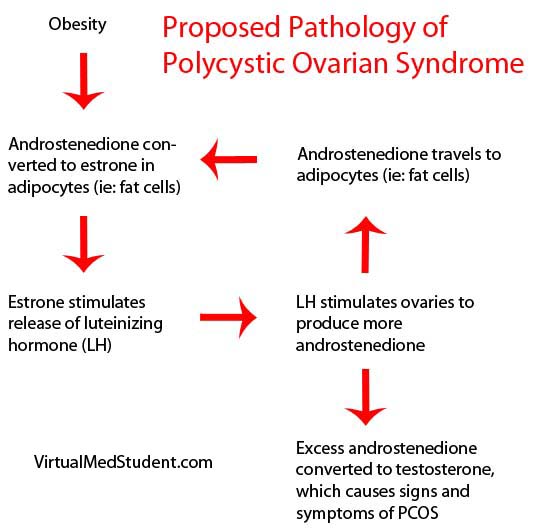
Polycystic ovarian syndrome (PCOS) is a well recognized disorder of androgen excess in females. The pathology behind this disorder is a cyclic process related to obesity and hormone excess.

The cycle begins when luteinizing hormone from the pituitary gland stimulates the ovaries to produce an androgen known as androstenedione. Androstenedione travels in the blood stream to adipocytes (ie: fat cells) where it gets converted to a specific estrogen called estrone. Estrone then travels in the blood stream to the pituitary gland where it stimulates the release of more luteinizing hormone.

The excess luteinizing hormone stimulates the ovaries to produce more androstenedione. At this point, some of the excess androstenedione gets converted to testosterone, which causes the signs and symptoms of polycystic ovarian syndrome; the rest of the androstenedione gets converted to estrone in fat cells which further fuels the cycle.

PCOS Pathology

Signs and Symptoms

The signs of polycystic ovarian syndrome are related to excessive estrogens and androgens. Excess androgens can cause hirsuitism (ie: growth of facial hair), acne, and oligo- or amenorrhea (ie: decreased frequency or lack of menstrual cycles, respectively). If severe enough, some women may have deepening of the voice and male-like balding patterns.

In addition, the elevated estrogen levels (ie: estrone) stimulate the proliferation of endometrial tissue resulting in abnormal uterine bleeding. If this occurs for a long enough period of time the patient is at risk for endometrial carcinoma.

Patients with polycystic ovarian syndrome are also at risk for other metabolic and cardiovascular diseases. Some patients develop diabetes mellitus, hypercholesterolemia, and hypertension. A substantial portion of patients also have co-existent metabolic syndrome.

Diagnosis

Diagnosis is made when at least two of the following three criteria are met:

(1) Oligo- or anovulation (ie: decreased frequency or lack of ovulation)
(2) Blood tests consistent with elevated androgen levels
(3) Polycystic ovaries seen on pelvic ultrasound

The name polycystic ovarian syndrome is somewhat of a misnomer because you do not need to have polycystic ovaries to be diagnosed with PCOS!

In addition laboratory data that supports the diagnosis of polycystic ovarian syndrome is an increased luteinizing hormone to follicle stimulating hormone ratio (increased LH:FSH), estrone levels greater than estradiol levels, as well as elevated androstenedione and/or testosterone levels.

Treatment

Treatment of polycystic ovarian syndrome is with birth control pills (oral contraception). The birth control pill decreases the release of luteinizing hormone by the pituitary, and breaks the cyclic pathology illustrated above.

In women who wish to become pregnant a medication known as clomiphene may be used. It is an anti-estrogen that ultimately causes an increased release of follicle stimulating hormone by the pituitary. The resulting increase in follicular development in the ovaries increases the odds of successful ovulation. Interestingly, an anti-diabetes medication known as metformin also increases the rates of ovulation and pregnancy in PCOS patients.

Since many patients also have metabolic syndrome it is important to begin treatments as necessary to control co-morbid conditions. Obese women should be encouraged to lose weight. Patient’s with diabetes and insulin insensitivity should be started on metformin. Patients with hypercholesterolemia may benefit from statin therapy.

Overview

Polycystic ovarian syndrome has a cyclic pathology related to obesity and elevated hormones. It causes masculinization with symptoms and signs like increased facial hair growth, balding, and lack of ovulation. Patients are also at risk for developing diabetes and other stigmata of the metabolic syndrome. Diagnosis is based on a combination of elevated androgens, polycystic ovaries, and abnormal menstrual cycles. Treatment is usually with oral contraception, although in women who wish to conceive, medications like clomiphene may be used.

References and Resources

Too Much Pee! Understanding Diabetes Insipidus

In order to understand diabetes insipidus we have to understand a little about how the kidneys reabsorb water. Water absorption in the kidney is dictated by a hormone known as vasopressin (aka: antidiuretic hormone). This hormone is synthesized in the hypothalamus of the brain, transported down the pituitary stalk, and excreted into the blood stream by the posterior portion of the pituitary gland.

Once in the blood stream vasopressin goes to the kidney where it binds to receptors on cells in the collecting ducts of the nephron. This interaction sets off a series of reactions that allows the kidney to reabsorb water from urine. The end result is that the body retains water and the urine becomes more concentrated (“Look mom my pee is yellow!”).

With this background, we can now discuss diabetes insipidus (DI). Diabetes insipidus occurs when the hypothalamus, or pituitary gland fail to communicate effectively with the kidneys. This can happen in one of two ways: the hypothalamus or pituitary can fail to send a signal (ie: vasopressin) to the kidney, or the kidney can fail to respond to that signal. The first case is known as “central” diabetes insipidus, and the second case is known as “nephrogenic” diabetes insipidus.

In either case, the kidney fails to reabsorb water. The end result is dehydration and a steadily rising blood sodium level, which can cause numerous signs and symptoms.

Signs and Symptoms

Patients with diabetes insipidus pee like crazy! This is because the kidney is unable to reabsorb water. Patients can urinate over a liter of fluid per hour! Because of this, the serum sodium level can increase precipitously. The resulting hypernatremia (ie: elevated sodium level) can cause seizures, altered mental status, and coma if not recognized and treated aggressively.

In addition, patients with diabetes insipidus are usually very thirsty. They typically ask for “ice water”, and will drink large volumes in an attempt to keep up with their urinary losses.

Diagnosis

Diagnosis is based on several clinical markers. Urine output greater than 250 mL/hour in the setting of a low urine osmolarity (50-150 mOsm/L) or specific gravity (1.001-1.005), a high normal or above normal blood sodium concentration, and a higher than normal blood osmolarity are indicators of diabetes insipidus.

Often times the diagnosis may still be difficult to make when only one, or a few of the above are present. If this is the case, a “water deprivation test” can be performed. This test is exactly what it sounds like: don’t allow the patient to receive any form of fluid (either intravenous or oral). You must monitor their condition carefully!

Under conditions of water deprivation, a normal person’s kidneys will start to retain water, and because of this, the urine will become more concentrated (usually to greater than 600 mOsm/L). However, in patients with diabetes insipidus the kidneys are unable to absorb water and the urine osmolality remains lower than expected (ie: the urine remains dilute).

If the water deprivation test is positive then the next step is to determine if central or nephrogenic diabetes insipidus is present. The easiest way to do this is to provide synthetic vasopressin (“thank god for the pharmaceutical companies!”). If the patient has central DI then the urine output will decrease, and the urine concentration will increase; in other words, the kidney is responding to the synthetic vasopressin.

However, in nephrogenic diabetes insipidus the patient will continue to have increased urine output and the urine concentration will fail to increase. In other words the kidney is unable to respond to vasopressin either in natural, or synthetic form.

Treatment

Treatment is dependent on what form of diabetes insipidus is present and how severe it is. Some patients with DI are capable of drinking enough water to compensate for their urinary losses and therefore require no specific intervention.

However, other patients may not be able to drink enough to keep up with their losses. This can occur in patients who are urinating so much that they can not possibly keep up orally, or in patients who are unable to drink for other reasons (ie: coma, swallowing problems, etc.). If this is the case, then a patient with central diabetes should be given artificial vasopressin, also known as desmopressin (DDAVP).

Patients with nephrogenic diabetes insipidus are treated with a combination of medications depending on the severity of their disease. Thiazide diuretics such as hydrochlorothiazide can decrease the urine output. Interestingly, non-steroidal anti-inflammatory medications like ibuprofen and indomethacin can decrease urine output by blocking the formation of prostaglandins, which normally inhibit the effects of vasopressin.

Overview

Diabetes insipidus occurs when the kidney fails to respond to vasopressin, either because vasopressin is not secreted by the pituitary, or because of an intrinsic defect in the kidney’s ability to sense vasopressin.

In either situation the kidney fails to reabsorb water, which causes dehydration and hypernatremia (ie: elevated sodium level in the blood). If the patient is unable to drink enough fluids the condition can be fatal. If oral rehydration is not enough, then patients with central diabetes insipidus can be treated with synthetic vasopressin analogues. In patients with nephrogenic diabetes insipidus diuretics such as hydrochlorothiazide and non-steroidal anti-inflammatory medications may  help decrease urine output. 

References and Resources

  • Trepiccione F, Christensen BM. Lithium-induced nephrogenic diabetes insipidus: new clinical and experimental findings. J Nephrol. 2010 Nov-Dec;23 Suppl 16:S43-8. Review.
  • Noda Y, Sohara E, Ohta E, et al. Aquaporins in kidney pathophysiology. Nat Rev Nephrol. 2010 Mar;6(3):168-78. Epub 2010 Jan 26. Review.
  • Ranadive SA, Rosenthal SM. Pediatric disorders of water balance. Endocrinol Metab Clin North Am. 2009 Dec;38(4):663-72.
  • Knepper MA, Verbalis JG, Nielsen S. Role of aquaporins in water balance disorders. Curr Opin Nephrol Hypertens. 1997 Jul;6(4):367-71.
  • Robertson GL. Regulation of arginine vasopressin in the syndrome of inappropriate antidiuresis. Am J Med. 2006 Jul;119(7 Suppl 1):S36-42.

Sugar Strip Down: Glycolysis and Energy Formation

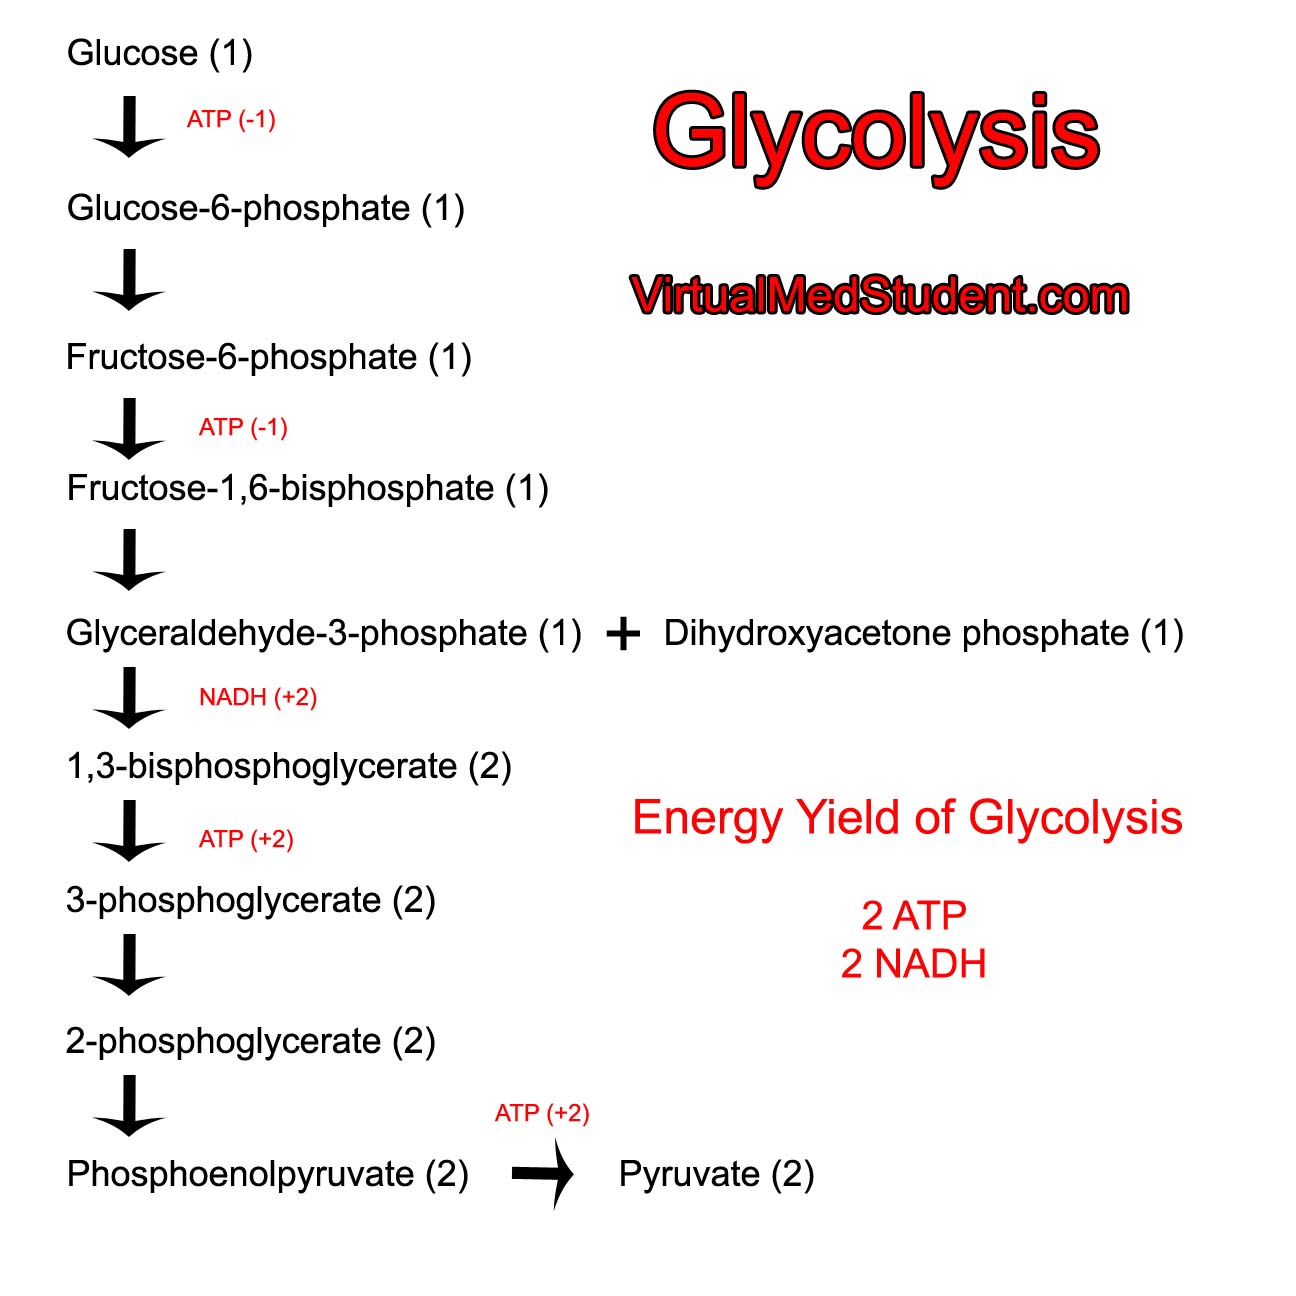
Glycolysis is the biochemical pathway that strips glucose of its energy. It starts with glucose and ends with pyruvate. Pyruvate is converted to acetyl-CoA, which can be stored as fat, or further metabolized in the citric acid cycle. The fate of pyruvate depends on the energy needs of the cell.

The net yield of energy from glycolysis is two adenosine triphosphates (ATP) and two nicotinamide adenine dinucleotide (NADH) molecules per glucose "burned" by the pathway. Each NADH molecule from glycolysis eventually generates 1.5 ATPs from the electron transport chain. Therefore, a total of 5 ATP molecules are produced per molecule of glucose consumed by the glycolysis pathway.

The net energy used or created (in the form of ATP or NADH) are shown in the schematic below:

Glycolysis

Want to know what happens to the NADH? Check out the article on the electron transport chain.

Regulation

Glycolysis is regulated at several steps in order to ensure that glucose molecules are used appropriately by the cell. The first point of regulation is at the conversion of glucose to glucose-6-phosphate (G6P). This reaction is catalyzed by an enzyme known as hexokinase. This enzyme is inhibited by its own product – G6P. This is known as "feedback inhibition". Once glucose is converted to G6P it becomes "trapped" inside the cell. Therefore, when there are adequate G6P levels any particular cell can shut off the flow of glucose into glycolysis so that it can be sent to other cells that may need it.

Phosphofructokinase 1
(PFK1) is the key
regulatory enzyme in the
glycolytic pathway.
The second, and key, regulatory point of glycolysis is at the enzyme phosphofructokinase-1 (PFK1). PFK1 converts fructose-6-phosphate (F6P) to fructose-1,6-bisphosphate. This enzyme is inhibited by ATP and citrate, and activated by ADP, AMP, and fructose-2,6-bisphosphate (note that this is a different molecule than fructose-1,6-bisphosphate). In other words, when the body is in an energy depleted state (ie: low levels of ATP and high levels of ADP and AMP) glycolysis is activated; under conditions of high energy (ie: high levels of ATP) glycolysis is inhibited. It is important to regulate the enzyme PFK1 closely because once F6P is converted to fructose-1,6-bisphosphate it MUST continue down the glycolytic pathway.

Side note: fructose-2,6-bisphosphate is produced by the enzyme phosphofructokinase-2 (PFK2) and degraded by the enzyme fructose bisphosphatase-2 (FBPase2). PFK2 becomes active under conditions of satiety (ie: well fed states in which lots of glucose/sugar is being absorbed from the gut). When PFK2 is active the concentration of fructose-2,6-bisphosphate increases. This activates PFK1 and increases the activity of the glycolytic pathway.

The final point of regulation is at the enzyme pyruvate kinase. This enzyme converts phosphoenolpyruvate into pyruvate. It is inhibited by ATP, acetyl-CoA, and long chain fatty acids, which are all markers of high energy levels.

In general, the overall regulation of glycolysis is related to how much energy the cell has. In energy rich states (ie: high ATP and low ADP/AMP) the cell slows glycolysis so that it can store glucose for use at a latter time. In energy depleted states (ie: low ATP and high ADP/AMP) the rate of glycolysis increases so that more energy can be formed by "burning" more glucose molecules per unit time.

Overview

Glycolysis breaks down glucose molecules. In the process the energy rich molecules ATP and NADH are formed. It is regulated at several enzymatic steps, most importantly at the enzyme phosphofructokinase-1. Pyruvate can be further metabolized to acetyl-CoA.

References and Resources

  • Nelson DL, Cox MM. Lehninger Principles of Biochemistry. Fifth Edition. New York: Worth Publishers, 2008.
  • Champe PC. Lippincott’s Illustrated Reviews: Biochemistry. Second Edition. Lippencott-Ravens Publishers, 1992.
  • Le T, Bhushan V, Grimm L. First Aid for the USMLE Step 1. New York: McGraw Hill, 2009.

Electron Transport Chain in All Its Glory

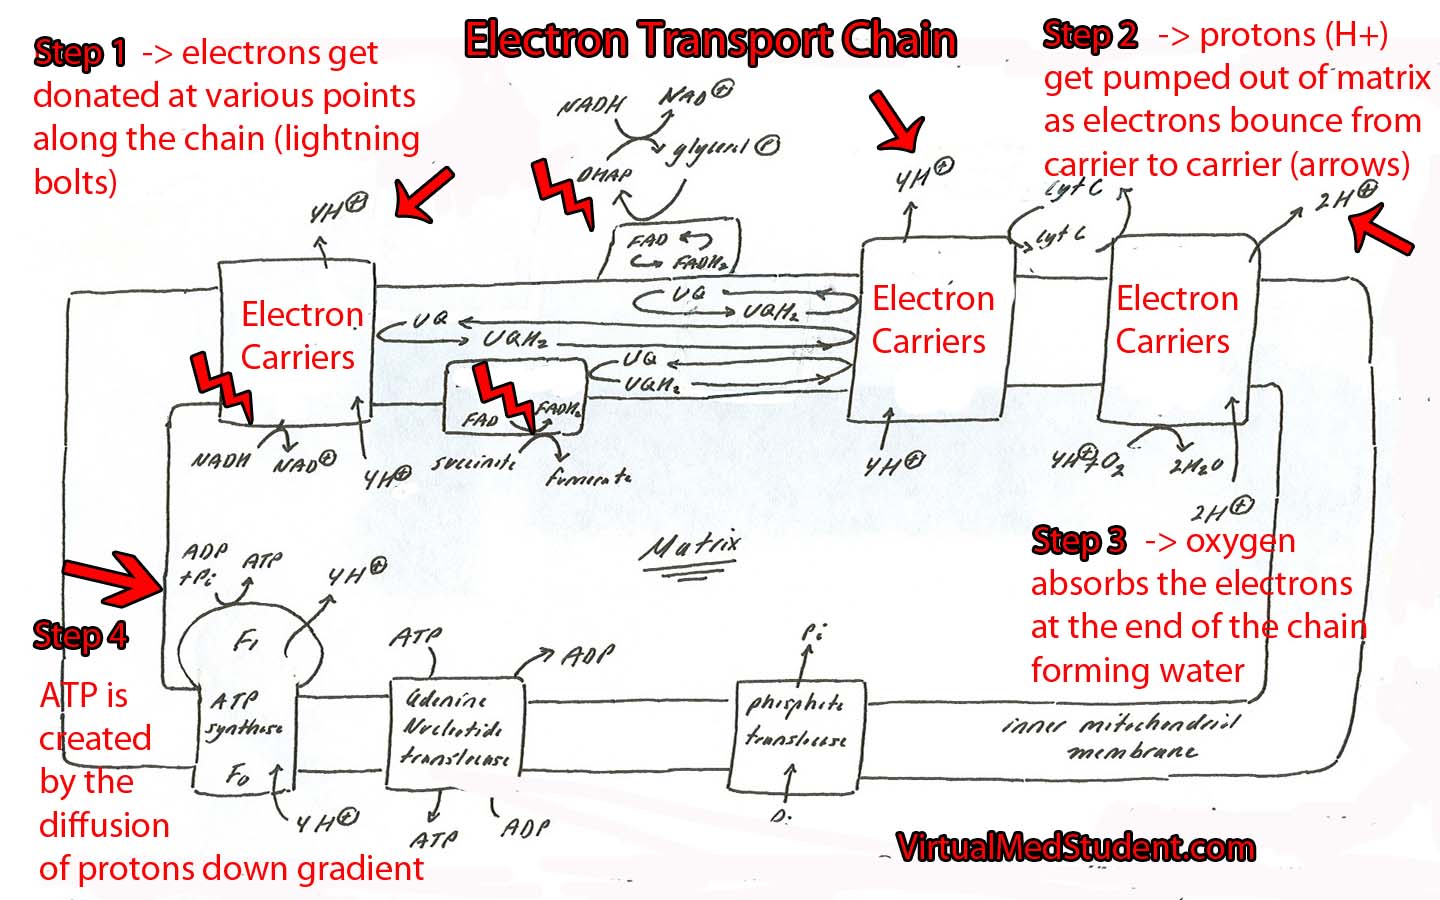
The electron transport chain is a series of interconnected proteins and carrier molecules that are embedded in the inner mitochondrial membrane. In order to understand the function of the electron transport chain in all its glory, we have to first appreciate two important molecules: NADH and FADH2. These two molecules can be thought of as energy dump trucks that strip sugars, fats, and proteins of their energy rich electrons (see the articles on glycolysis and the Kreb’s cycle for more details on how sugars and fats get stripped of their energy).

NADH and FADH2 then transfer their electrons to specific carrier molecules that constitute the “electron transport chain”. From there, the electrons "bounce" from carrier molecule to carrier molecule as if they were falling down an energy waterfall. Each time they bounce between carrier molecules energy is emitted; this energy is used to pump protons out of the mitochondrial matrix.

As protons get pumped out of the matrix they form an electrochemical gradient. As more electrons bounce down the chain, more protons get pumped out of the matrix. Eventually the concentration of protons outside the mitochondrial matrix is much higher than the concentration inside the matrix.

This is where the plot thickens… At this point all of the protons outside the matrix want to diffuse down their concentration gradient to their "home" in the matrix. However, the membrane that lines the matrix is impermeable to protons… Except at one specific point!

That point is a specialized enzyme embedded in the membrane called ATP synthase. The sole function of this enzyme is to rejuvenate a molecule known as adenosine triphosphate (ATP).

As the protons flow down their concentration gradient through the ATP synthase they release energy. The synthase uses this energy, via a wonderfully complicated molecular gear shifter, to form ATP from ADP (adenosine diphosphate) and free phosphate. This process is formally known as oxidative phosphorylation.

ATP is an energy rich molecule that can be thought of as the gasoline used to run a car. In simple terms, if a cell is building a molecule (ie: protein, DNA, RNA, etc.) it is likely using the energy in ATP to do it. When ATP runs out, the cell stops producing molecules and is in jeopardy of dying.

Electron Transport Chain Schematic

The whole point of the electron transport chain is to produce more ATP by using the energy obtained from the electron pillaging of molecules like glucose, long chain fatty acids, and proteins!

So what happens to the poor old electrons? Oxygen absorbs them at the end of the chain and forms water! This is why humans require oxygen to live! Without oxygen, electrons back up in the chain and eventually the whole transport system grinds to a halt.

Regulation

Like every other biochemical pathway in the body, the electron transport chain is under strict regulation. When ATP is abundant in the cell the chain slows down (ie: why drop electrons down the chain and strip sugars, fats, and proteins of their energy when you don’t have to?).

However, when the cell has little ATP around, then the chain springs in to action as the body burns sugars, proteins, and fats to create the electron carriers necessary to run the chain.

There are several points in the chain where things can turn awry. The first is if there is no oxygen. Oxygen is the last point in the electron "waterfall". Once the electrons get to the last carrier in the chain they have no where to go but to reduce oxygen to form water.

Without oxygen the electrons back up like lemmings. Eventually the whole chain becomes saturated with electrons and causes the whole system to stop, which can be disastrous to cellular function.

Overview

So let’s bring it all together… Cells strip sugars, proteins, and fats of their energy rich electrons. These electrons hitch a ride on special molecules like NADH and FADH2. NADH and FADH2 donate their electrons to special carrier proteins embedded in the inner mitochondrial membrane. The electrons bounce from carrier to carrier releasing energy. The released energy is used to pump protons out of the matrix. The resulting energy rich proton gradient is then used to create ATP as the protons flow down their concentration gradient back into the matrix through the ATP synthase unit… Now go drink another cup of coffee!

References and Resources

  • Le T, Bhushan V, Grimm L. First Aid for the USMLE Step 1. New York: McGraw Hill, 2009.
  • Kumar V, Abbas AK, Fausto N. Robbins and Cotran Pathologic Basis of Disease. Seventh Edition. Philadelphia: Elsevier Saunders, 2004.
  • Champe PC. Lippincott’s Illustrated Reviews: Biochemistry. Second Edition. Lippincott-Ravens Publishers, 1992.
  • Nelson DL, Cox MM. Lehninger Principles of Biochemistry. Fifth Edition. New York: Worth Publishers, 2008.